Interpreting Latest Employment Data
STORIES, ANALYSES, EXPERT VIEWS
The Ministry of Statistics and Programme Implementation two weeks go, released the results of the Periodic Labour Force Survey for the period July 2022 to June 2023. This is the sixth PLFS report and each tracks a 12 month period between July and June.
The annual PLFS — as well as its predecessor, the quinquennial Employment-Unemployment Surveys — are conducted by the National Sample Survey Office in order to get an understanding about the state of employment in India.
Significance of PLFS data
The PLFS, explains Udit Misra (Business Standard • Senior Assistant Editor, Opinion) provides data on different metrics so that the policymakers can understand the proportion of people demanding work, the proportion of people among them who failed to get a job, the gender differences in employment as well as wages etc. The PLFS also tells the sectoral distribution of workers in the economy — what percentage is involved in agriculture, for instance. It also records the type of work people do — for instance, how many are engaged in casual labour, how many work for themselves, and how many have regular salaried jobs etc.
Findings
Misra explains the latest findings.
Unemployment Rate (UER): The UER refers to the proportion of people who demanded work over the past year and failed to get it. For the population above 15 years of age, the UER has fallen significanlty — from 6.6% to 5.1% over the last year (that is, July to June cycle). Simply put, 5.1% of all the people above 15 years of age who demanded work failed to get one.
Labour Force Participation Rate (LFPR): The LFPR is a measure of the total population demanding work, and it is presented as a proportion of the total population that is above 15 years of age. Data shows India’s LFPR, which had been inching up, shot up significantly in the past year. As of 2022-23, 54.6% of all Indians above the age of 15 were looking for a job.
LFPR for women: This metric looks at LFPR for among women to ascertain where the additional demand for jobs is coming from. The data shows that female LFPR has gone up over the years but there were two discrete step-ups — one in 2019-20 (when India’s GDP growth rate had slowed down to less than 4% and this was before the Covid pandemic hit) and second in 2022-23 when it rose to 31.6%.
Worker Population Rate: There is another way to look at the labour market: Worker Population Ratio (WPR). The WPR is the percentage of persons employed among the persons in the population. Thus, instead of looking at how many demand a job and how many fail to get it, the WPR simply gives a measure of how many people have a job as a proportion of the total population. This metric too has been going up and especially noteworthy are the two discrete step-ups in 2019-20 and 2022-23.
WPR among women: This metric throws light at the WPR for women to understand what’s leading to the spike in overall WPR. Again, the WPR for women has been going up but two main spikes have been in 2019-20 and 2022-23.
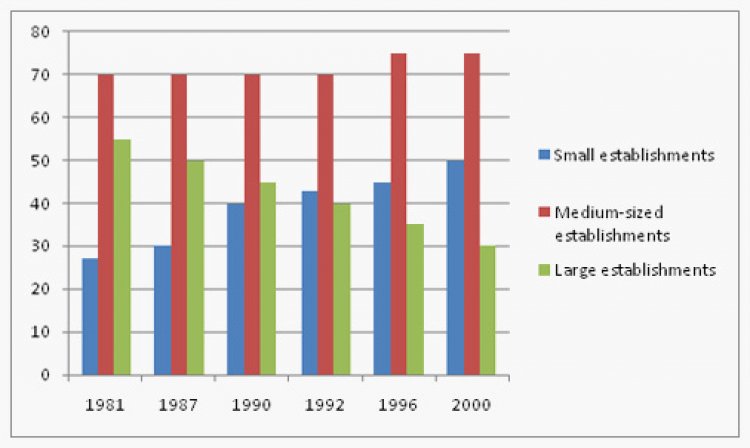
Distribution of workers: The present data gives the details of the three main classifications: self-employment, casual labour (say a construction worker) and regular salaried job. Self-employed has two sub-categories: (i) own account worker and employer and (ii) unpaid helper in household enterprises. The data shows that self-employment has risen and jobs in the other two categories have fallen in proportion. It is also noteworthy that self-employment among women is the key driver for this overall trend.
Conclusions
At first glance, Misra concludes “PLFS 2022-23 throws up some positive trends: Unemployment rate continues to fall, LFPR and WPR see significant spikes. In particular, it is heartening to note that more and more women are joining the workforce. This would suggest that as the Indian economy recovers, more and more well-paying jobs are getting created.
“However, when one looks at what these new jobs are and how much they pay, the understanding changes. That’s because the only jobs that are getting created are of the ‘self-employment’ type. When an economy grows, businesses employ people. When an economy struggles, people lose their regular jobs, and become ‘self-employed’.”
Similarly, “the trend for women across all metrics suggests that weak household finances have pushed women, who were outside the workforce in the past, to join in, often as ‘unpaid helpers in household enterprises’.”
Similarly, sectorally, too, “India seems to be moving backwards with the proportion of Indians employed in agriculture going up over the past year while those in manufacturing having fallen.”
Lastly, “a booming economy sees monthly incomes improve. However, that is not the case in India.”
![]()